Key Points of article about Dielectric and spectroscopic property of glass


As per study, Adding Bi2O3 up to 12.5 mol% decreases the thermal stability and increases the crystallization behavior of prepared non-crystalline solids.

Kubelka-Munk function is used to measure the optical band gap of glasses.

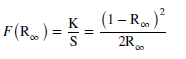
where R∞ is the relative remittance (R∞=Rsample / Rstandard) , 

S is the sample’s scattering coefficient, 

K is the absorption coefficient, and 

F(R∞) is the K-M function or the remission function.


Tauc equation has been used to calculate band gap energy.

By increasing the Bi2O3 content, the band gap energy slightly increases.

Here Non-bridging oxygen (Connected to only one P atom, associated with a metal ion (P-O-M)) ions decrease, a development of bridging oxygens occurs and the dense glass structure is created.)


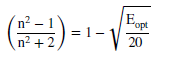
The refractive index decreases with increase in Bi2O3. It was calculated for the glass using the Dimitrov and Sakka equation.

The trivalent cations(Bi3+)  improves the strength of phosphate glass due to the relative ability of the glass matrix which leads to the creation of the M3+–O–P bond.


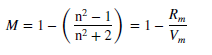
With the addition of Bi2O3 content in the glasses, Metallization criterion(M) values increased. refractive index and optical band gap of the material

have an impact on  M values.

The replacement of the P2O5 by 2.5 mol% of Bi2O3 leads to a decrease in ac-conductivity values, and then the conductivity rises with more replacement of the P2O5 content to 10 mol%. The main reason for the conduction is the presence of Li+ions.


For an Oxygen/Phosphorus ratio < 3, and in spite of the high concentration of Bi3+ ions, the O–P bond becomes longer, which results in decreasing the polarizability and hence, the conductivity of the glass.


At low frequencies, tangent loss (dissipation of energy) is high and reduces as the frequency goes to high due to the presence of Maxwell-Wagner-Sillars polarization. (It occurs at regions with different electrical properties e.g. conductivity or permittivity. It describes the accumulation of charge at interfaces between different phases or regions when an alternating electric field is applied.)


M'(electric modulus) has low values at low frequency, then increases with rising frequency until it attains a constant value at f > 6 kHz due to the increase in the movement of the charges under a high-frequency electric field.


Source: https://link.springer.com/article/10.1007/s00339-024-08103-4


Overview of article related to Rotation periods of asteroids


The Yarkovsky effect is a phenomenon that causes force to act on a rotating celestial body, such as an asteroid, due to the way it absorbs and re-emits sunlight as heat. The Yarkovsky effect depends on many physical and surface properties of the body such as diameter, albedo, density, obliquity, and rotation period.


The visual magnitude V of an asteroid is a measure of how bright it appears to an observer.  

Heliocentric distance r is the distance between the object and the sun's center. 

H is the absolute magnitude of the asteroid,

Delta is range to the observer (in au), 

g(t) is a periodic function related to the asteroid shape in rotation, it is used to describe the repeating brightness variations (light curve) of an asteroid over time.

The phase function describes how brightness evolves with the phase angle(the Sun-asteroid-observer angle). The phase function is second-degree polynomial here.


To find g(t), fourier series has been used upto 10 order here.

If the shape of an asteroid is well-described by a tri-axial ellipsoid, the light-curve is expected to display two local maxima and two local minima. local maxima and local minima are the peaks and troughs of the asteroid's brightness variations over time. 


Source: https://arxiv.org/abs/2501.07189 


Brief Summary of article: Interlayer dislocations in MoS2

The minimal energy density has been found for a dislocation with its axis oriented along the zigzag direction (α = 90◦),

screw dislocation energy density increases logarithmically with the number of layers.


The strongest piezoelectric charge densities are in the layers closest to the dislocation plane.As far a layer is from the dislocation plane, the smaller the charge density.


For a bilayer, the piezoelectric potential (When an external force is applied, the material's internal structure deforms, separating the centers of positive and negative charges) is strong and varies significantly across the dislocation. For tetralayers and hexalayers, the potential weakens in the outer layers, the alternating charges cancel each other.


https://iopscience.iop.org/article/10.1088/2053-1583/ad9f7d


Summary of Article related to magneto ferroelectricity effect


Ferroelectricity: It is a characteristic of certain materials that have a spontaneous electric polarization that can be reversed by the application of an external electric field.


Magneto Ferroelectricity:

Magnetic spins interact with the lattice structure, leading to a coupling between magnetic and ferroelectric properties. Here the applied magnetic field causes the structural deformation of the material by changing the bond lengths and bond angles, which inevitably leads to the change of internal dipoles.


The magnetic interactions of transition metal ions with unpaired d electrons are generally sensitive to the deformation of bond lengths and angles.


(TMCM)[FeCl4] was studied here.

A second harmonic generation was conducted.  It indicates change of noncentrosymmetric structure to a centrosymmetric. SHG signal changes sharply around 320K.


The local ferroelectric domains within (TMCM)[FeCl4] were calculated by piezoelectric force microscopy (PFM). Magnetostriction was measured by Atomic Force Microscopy. (Magnetostriction is the ability of a material to undergo mechanical strain in response to a magnetic field.)


The external magnetic field strongly affects the ferroelectric loops, leading to changes in their symmetry, amplitude, and coercive fields( Coercive field is the strength of a magnetic or electric field that's required to demagnetize or depolarize a material). 

As per study, polarization along the a-axis is suppressed by the magnetic field,which corresponds to the stretching of the halogen Cl‧‧‧Cl bonds and the shrinking volume occupancy of [FeCl4]− anions.


The density functional theory (DFT) calculations were performed with projector-augmented wave pseudopotentials-a technique used in electronic structure calculations.


polarization was calculated using the standard Berry phase method. This helps to calculate valence electronic and ionic contribution.


source:

https://www.nature.com/articles/s41467-024-49053-y#:~:text=Magnetostriction%20loops%20are%20observed%20in,the%20results%20of%20AFM%20measurements.


article about ferromagnetic coupling in CrI3 - In Brief


Methods Used: Projector augmented wave (PAW) method is a numerical algorithm that is used to perform efficient density functional theory (DFT) calculations. The generalized gradient approximation (GGA) is a method that improves the description of nonuniform electron distributions in molecules, solids, and atoms.


The bilayer CrI3 has interlayer antiferromagnetic coupling. For introduction of dopants O, P, S, As, and Se substitution at the I1(I2) site leads to interlayer ferromagnetism. For C or N doped cases, interlayer antiferromagnetism occurs.


As per study, there is no correlation between the strength of ferromagnetic coupling and the interlayer distance. The interlayer magnetism of vdW materials is closely related to different 3d electron occupation between different layers.

As-doping leads to obvious change of charge distribution inside the interlayer space.


Interlayer ferromagnetic coupling in doped bilayer CrI3 occurs due to formation of localized spin-polarized state. It is a small region where the electron spins are aligned, creating a tiny magnetic area due to something unusual (like a dopant) in the material. This tiny magnetic area can have a big effect on the material’s overall magnetic behavior.


Source: https://link.springer.com/article/10.1007/s11467-024-1435-2#:~:text=Further%20analysis%20shows%20that%20the,can%20realize%20interlayer%20ferromagnetic%20coupling.


Brief Summary of article related to radiation by carbon-ion beam

Microdosimetry is a technique used to measure the stochastic(process that evolves in a random way) distribution of energy deposited by radiation at microscopic sites. It can help determine how energy is transferred inside cancer cells. 


In study, three sensitive volumes (SVs) of different thicknesses have been used.

Lineal energy is the amount of energy deposited in a given volume of matter by a single energy-deposition event, divided by the mean chord length of that volume.

lineal energy dose distribution d(y): It describes the probability density of the energy deposited in a volume by ionizing radiation.

f(y) is the lineal energy probability density function and ¯y(F) its expectation value, called frequency-mean lineal energy.

The microdosimeter measures current pulses proportional to the energy deposited by a single-event.


Double linearinsed method

alin is the linearised signal amplitude, ach is the signal amplitude in acquisition-channels units and mA,mB and q are the three linearisation coefficients. aT is a free parameter.


The final calibration in lineal energy was then obtained according to the carbon-edge method. The carbon-edge method is calculated from the stopping power values of carbon ions. Stopping power in medical physics is the average amount of energy a material absorbs from a charged particle as it moves through the material.

The calibrated data obtained are eventually organised in the form of a histogram with logarithmic lineal energy.

By calculating first order approximation of taylor series, Final uncertainty was measured by

water-equivalent depth uncertainty was measured in study.

The thickness of the sensitive volumes (SVs) in microdosimetry significantly influences the radiation quality measurements.

Thinner detectors are more sensitive to high-energy events but are affected by noise and lower energy thresholds. Thicker detectors can better capture a broader spectrum of radiation, especially in regions dominated by secondary particles.


Source: https://iopscience.iop.org/article/10.1088/1361-6560/ad965e


Key Points of article about new hydrogen-deficient white star


Scientists found 3 pre-white dwarfs (WDs) with helium-dominated atmospheres.

They calculated the effective temperature and surface gravity by comparing the He II line profiles of different stars.


Tübingen Model-Atmosphere Package tool was used for spectral analysis and to compute nonlocal thermodynamic equilibrium, plane-parallel, line-blanketed atmosphere models in radiative and hydrostatic equilibrium. It is based on the Accelerated Lambda Iteration method.


Kiel (Teff– log(g)) diagram was used to analyse the stars. The masses of stars were determined via comparison with evolutionary tracks using linear interpolation or Extrapolation and use of very late thermal pulse (VLTP)- a stage of evolution that occurs when a star re-ignites helium after leaving the Asymptotic Giant Branch (AGB) and still has a hydrogen-burning shell. By using these parameters, stellar radii was calculated by,

Luminosity was calculated by,

Gaia parallax distances can be used to derive masses, radii, and luminosities.

They used a spectral energy distribution (SED) graph that shows how much energy a star emits at different wavelengths. It's usually represented as luminosity per unit wavelength or frequency.


Source:

https://arxiv.org/html/2412.15984v1