Summary of Article: The topological aberrations of twisted light


  • Topology describes the study of properties of spaces that are invariant under any continuous deformation.

  • Topological aberration: It contains a high-order optical vortex which experiences not only geometrical shifts, but an additional splitting of its high-order vortex into a constellation of unit-charge vortices.

  • Multiple optical vortices indicate  the presence of more than one optical vortex in a light beam. Each optical vortex is a point or region where the intensity of light is zero, and the phase of the light waves spirals around this point, creating a "twisted" or helical wavefront. These beams are characterized by their helical wavefronts.

  • Goos-Hänchen (GH) Shift: The GH shift is a lateral displacement of a reflected light beam along the plane of incidence. Instead of reflecting exactly along the predicted path, the beam's central position shifts slightly parallel to the interface. GH shift arises from changes in the reflection coefficient of the interface, which vary with the incidence angle. These changes affect the beam's overall phase, leading to a shift.
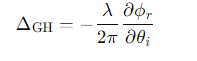
  • ΔGH​ is the lateral shift (Goos-Hänchen shift), λ is the wavelength of the light. ϕr​ is the phase of the reflection coefficient, θi​ is the angle of incidence.

  • Imbert-Fedorov (IF) Shift : It is a transverse displacement of a reflected  beam that occurs perpendicular to the plane of incidence.

  • In the context of vortex constellations, the coordinates of the vortices can be represented as complex numbers. The authors use Elementary Symmetric Polynomials(ESP)  to summarize these coordinates and understand how they change under reflection.

  • vectors eI and eR contain the ESPs of the input and aberrated constellations, respectively.

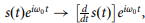
  • Wirtinger Derivative: It helps how a complex function (or light beam) changes, especially when dealing with distortions or shifts in the beam's structure.

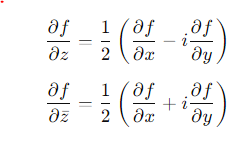
  • Above equations applying for this experiment,

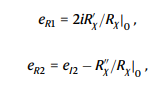
  • R’ and R” are first and second Wirtinger derivatives of R(χ) at χ = χ* = 0.

  • Aberrations usually change the elementary symmetric polynomials (ESP), which describe the positions of the vortices in a group (constellation). From these changes, we can directly figure out the angular Wirtinger derivatives related to the aberration.


https://www.ncbi.nlm.nih.gov/pmc/articles/PMC10305470/

https://www.nature.com/articles/s41467-024-52529-6


Summary of Article about Mercury’s plasma environment


The instruments designed to measure ions in Mercury’s plasma environment are: 

Mass Spectrum Analyzer (MSA), Mass Ion Analyzer (MIA), and Mass Electron Analyzer (MEA).


  • Mass Spectrum Analyzer: This instrument has a spherical top-hat analyzer for energy analysis and a Time-Of-Flight (TOF) chamber for mass analysis.
  • For ions passing through the top-hat analyzer, the energy-to-charge ratio is:


  • This energy allows the MSA to filter ions with specific energies before they enter the Time Of Flight chamber. TOF analyzer measures the time t it takes for ions to travel a fixed distance d after they pass through the top-hat analyzer. From the TOF data, the ion’s velocity can be calculated. Then the mass-to-charge ratio m/q is calculated.


  • The MSA uses a reflectron TOF system, which improves the mass resolution by reflecting ions back and forth within the TOF analyzer. If there are small differences in ion velocities, more accurate m/q can be measured.

Differential Directional Energy Flux (DDEF) of the ions and electrons is measured by MSA, MIA and MEA.

  • N is the number of particles,
  • E is the particle energy,
  • A is the detector area,
  • T is time, Ω is the solid angle,
  • Θ and ϕ represent the direction of travel of the particles in spherical coordinates.


Magnetospheric regions and ion composition:

  • The low latitude boundary layer(LLBL) is a region where magnetosheath and magnetospheric plasmas are mixed along the magnetospheric side of the low-latitude. There is presence of an energy dispersion( how particles with different energies spread out as they travel through a magnetic field of the ions). This dispersion extends from ~20 keV e−1 in the outer part of the flank down to 10s of eVs per e in the inner part.
  • Kelvin-Helmholtz Instability occurs at the interface between two plasma flows with different velocities, such as between the solar wind (a stream of charged particles from the Sun) and a planetary magnetosphere or at the boundary of different plasma regions.
  • In study, H+  trajectories were computed using a modified Luhmann–Friesen model for the magnetic field combined with convection pattern for the electric field. The full equation of motion was integrated  using a fourth-order Runge–Kutta technique.
  • The plasmas sheet horns: In this region, there is presence of ~1 keV e−1 ions in the near-tail central plasma sheet extending to the higher latitudes.
  • The flyby provided direct evidence of Mercury’s ring current. It is a circulating flow of charged particles around the planet, having energetic hydrogen ions (H⁺) and heavier ions like oxygen (O⁺)
  • The ion observations highlight the presence of cold ions (≤50 eV e−1 ) and energetic ions (up to 38 keV e−1 ) in the environment. Energetic electrons up to 10 keV e−1 were also observed in the deep magnetosphere. 


https://www.nature.com/articles/s42005-024-01766-8


Overview of Article: Method to analyze CO2 and H2O2 on pluto’s moon surface


Researchers used data reduction which includes steps:

Extracting Charon’s spectrum: The Point Spread Function (PSF) is used to describe how a point source of light (such as a star) is spread across an imaging system, such as a telescope and its detector. It is used for image resolution and sharpness. PSF technique yields a significantly enhanced signal-to-noise ratio

x,y are the spatial coordinates.

σ is the standard deviation of the Gaussian, related to the width of the blur.


r is the radial distance. 

α, β are seeing dependent parameters


Correction of  flux contamination: The minor blending has been observed of the fluxes from two binary components charon and pluto. Here Charon is on a diffraction spike of Pluto’s PSF.


Flux loss correction: Scientists used Near-Infrared Spectroscopy observations of the G2V-type solar standard star. They used cubic polynomial curves.Then flux is converted to radiance factor I/F.


BY studying spectral modeling of the surface, scientists showed that CO2 is present in pure crystalline form

Hapke Radiative Transfer Theory is used to describe how light scatters, reflects, and absorbs when it hits the surface of a planet, moon, or asteroid. The theory is used for analyzing observations of surfaces covered with ice or dust.


Reference:

Summary of Article: Temporal signal processing method for optical metasurfaces


The temporal signal: Temporal signal varies with time. It is used to identify patterns, or changes in audio signals, video frames, or sensor readings. In optics, it is used for shaping, filtering, or differentiating light signals to data transmission or image processing.

The metasurface is very thin material that can manipulate electromagnetic waves in ways that normal materials can't. At the nanoscale, metasurfaces can change how light bends and focuses.

Nonlocal metasurface: It manipulates light in ways that depend on the light's current position and where the light has been before. It  detects changes over time in a light signal. study shows that they can efficiently perform operations like first-order differentiation of signals.


Here metasurfaces material is TiO2-coated glass substrates is used. The Fourier transform of an input signal is calculated then multiplying it by the metasurface transfer function calculated and then applying the inverse Fourier transform.

The transfer function tω dictates how the metasurfaces affect different frequency components of the impinging pulse. 


metasurface with a transfer function


signal Sin(t) ( a square pulse) is encoded in the envelope of an electromagnetic wave impinging on a metasurface. The envelope of the transmitted wave is the first-order derivative of the input pulse.


Assuming  electric field pulse created by the pulse shaper is given by the sum of two gaussian pulses,

CCT Cross-Correlation Trace : CCT helps determine how the output signal produced by the metasurface correlates with the input signal. By comparing these signals, researchers can evaluate how effectively the metasurface performs differentiation.


CCT of the input field

CCT of output field


Reference: https://www.nature.com/articles/s44310-024-00039-0


Overview of Article: Use of Photoacoustic Tomography(PAT) for Clinical vascular imaging


Process:

In study, Researchers used an optical parametric oscillator (OPO- a laser device that converts a high-energy laser into two lower-energy beams through a nonlinear optical process) to generate the photoacoustic waves and an Fabry-Pérot FP ultrasound scanner to map them over the surface of the skin. 


In photoacoustic tomography (PAT), the OPO is used to generate light pulses that are absorbed by tissues, generating ultrasound waves for high-resolution imaging. 


Nanosecond laser pulses in the 700–900 nm spectral range (where tissue attenuation is low) are emitted by the OPO. The light beam incident on the acoustically sensitive thin film polymer. Fabry-Pérot interferometer(FPI) consists of two parallel, partially reflective mirrors separated by a small distance,. Light that enters the cavity undergoes multiple reflections between the mirrors.


The FPI is transparent in the 560–1,300 nm wavelength range, the beam passes through the sensor, illuminates the tissue, which generates ultrasound waves. These waves propagate to the FPI, interfere between the light reflected from the two FPI mirrors, resulting in a modulation in the reflected optical power.


Here, scan times can be reduced to a few seconds and even hundreds of milliseconds by parallelizing the optical architecture of the sensor readout, by using excitation lasers with high pulse-repetition frequencies and by exploiting compressed sensing.


Equations :

Photoacoustic Wave Equation

  • p(r,t) is the acoustic pressure at position r and time t.

  • c is the speed of sound in the medium.

  • β is the thermal expansion coefficient of the tissue.

  • Cp​ is the specific heat capacity of the tissue.

  • H(r,t) is the heat source term, which depends on the light absorption in the tissue, function of the light fluence (power per unit area) and optical absorption coefficient.

heat source H(r,t) is proportional to the absorbed optical energy:

  • μis the optical absorption coefficient at position r.

  • ϕ(r,t) is the optical fluence or energy deposition from the laser pulse.

initial pressure generated due to thermal expansion

Γ is the Grüneisen parameter, a factor that represents the efficiency of converting absorbed optical energy into pressure rise.

Reference: https://www.nature.com/articles/s41551-024-01247-x

Key Points of Article about Use of Speckle contrast optical spectroscopy in biology


Equations:

The brain blood volume is extracted from the camera images by calculating the ratio of the mean time-varying intensity ⟨I(t)⟩ over the baseline intensity, cerebral blood volume index CBVI


The brain blood flow is extracted from the camera images by calculating the cerebral blood flow index (CBFI)

K 2 adjusted is the adjusted speckle contrast (which indicates information about the particle motion, i.e. blood flow velocity in a region) obtained by subtracting the raw speckle contrast K 2 raw by all sources of noise.

a breath-holding index


Method:

  • When coherent laser light from a laser diode is directed onto a tissue (e.g., the brain), the light scatters as it passes through the tissue.

  • The properties of the speckle pattern (a grainy image that appears when a laser illuminates biological tissue) depend on the movement of particles within the tissue, blood cells.The faster the blood flow, the quicker the speckle pattern fluctuates.

  • where there is no blood flow, the speckle pattern remains relatively constant. 

  • By analyzing the rate at which the speckle pattern changes, SCOS measures the relative speed of blood flow in the tissue. The higher-risk group exhibited a greater increase in brain blood volume. 

  • Blood flow signal is recorded as a function of time. Here the heart rate is extracted from the blood flow via Fourier transform.

6083&id=560941