The study was done on effects of temperature, Langevin friction and external shear stress on the rates for dislocation to overcome the energy barrier interactions in FCC copper.
They used Kramers theory equations.(Kramers Rate Equation helps predict how dislocations (line defects) move through a crystal, which directly affects the strength, ductility, and failure of materials)
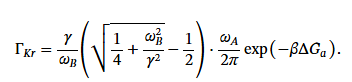
Langevin friction (gamma Y) refers to the damping force, or resistance to motion, that a particle experiences when interacting with a surrounding medium. Higher Langevin friction makes it slower for dislocations to move. It Does Not Change the Energy Barrier Itself.
At higher temperatures, the dislocation motion doesn't follow the usual straight-line pattern with temp which happens in Arrhenius behavior.
The non-Arrhenius behavior is stronger when the shear stress gets to near τ cross which forces the enthalpy barrier to decrease.
Source:
https://arxiv.org/html/2504.21246v1